Footfall in York city centre
Overview
Footfall information counts the number of people (typically in shopping centres) who walk past particular cameras over a period of time. It shows how busy an area is over a period of time and is used by retailers to help them consider where to put their stores, store opening hours and how many staff they need.
Open data showing hourly footfall from several cameras in York city centre every hour from 2009 until late in 2018 is available. This seemed fun so I downloaded it and had a play with what it showed.
Average Saturday footfall peaks at 2pm
I generated a map showing the four camera locations and footfall every hour during an average Saturday in 2018:
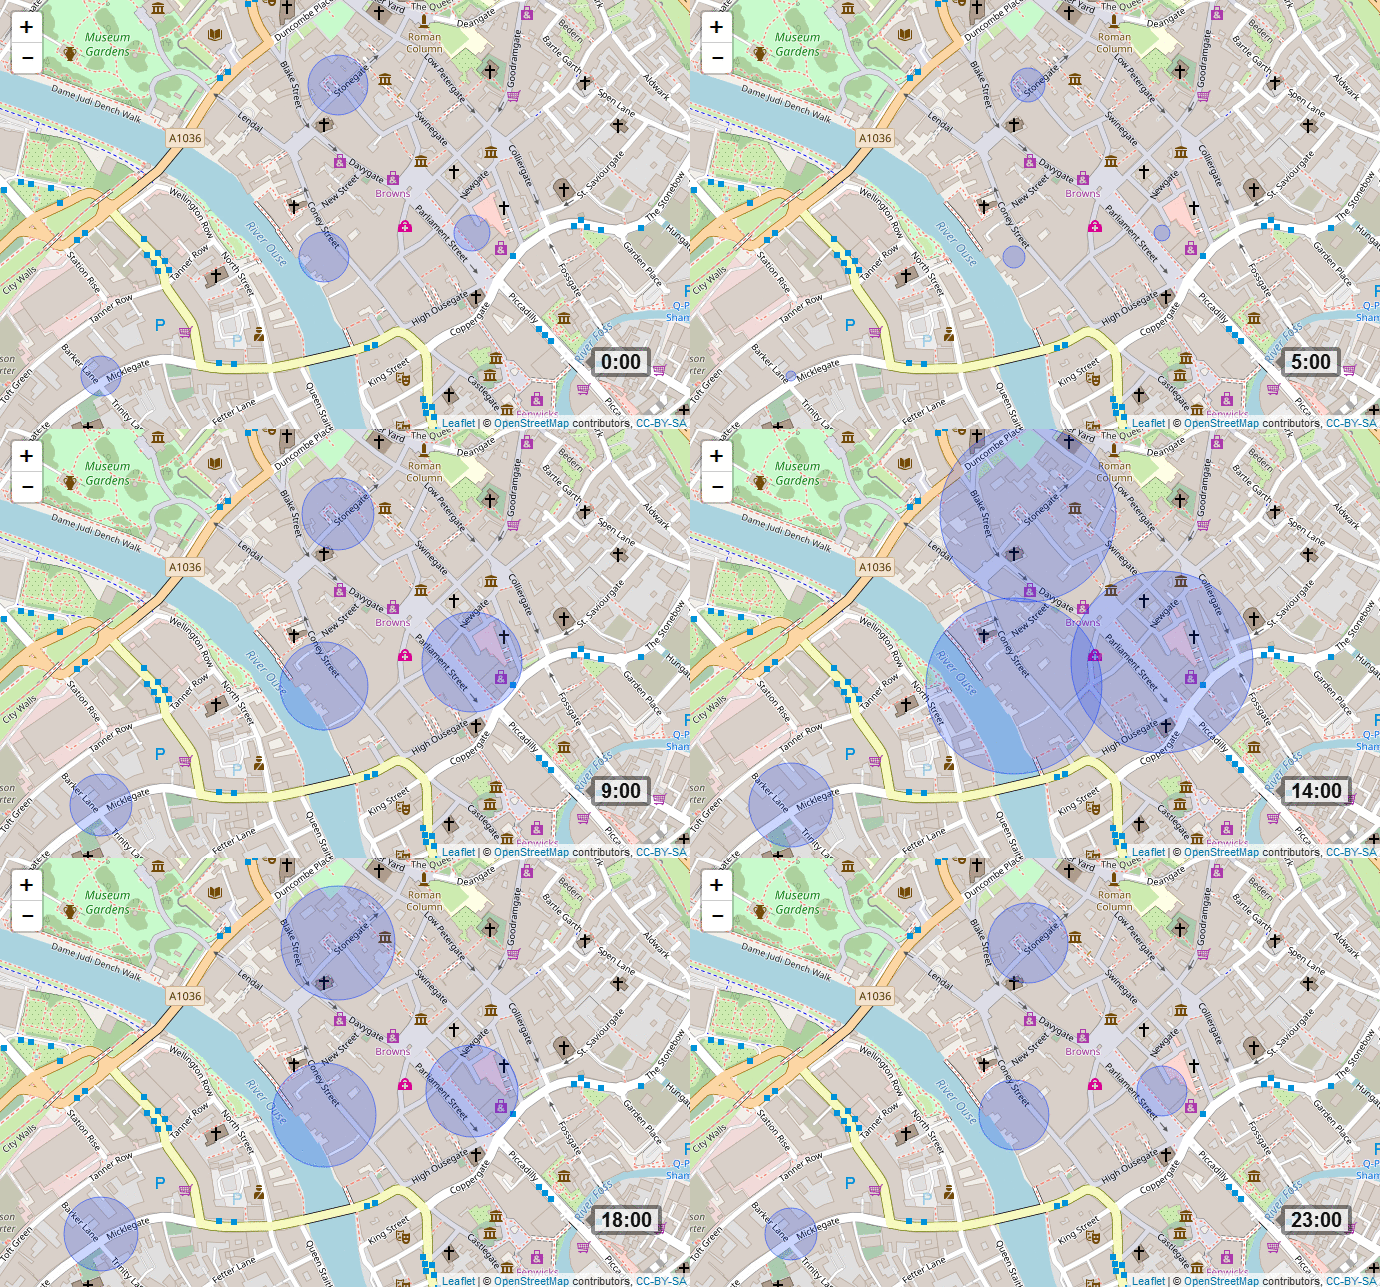
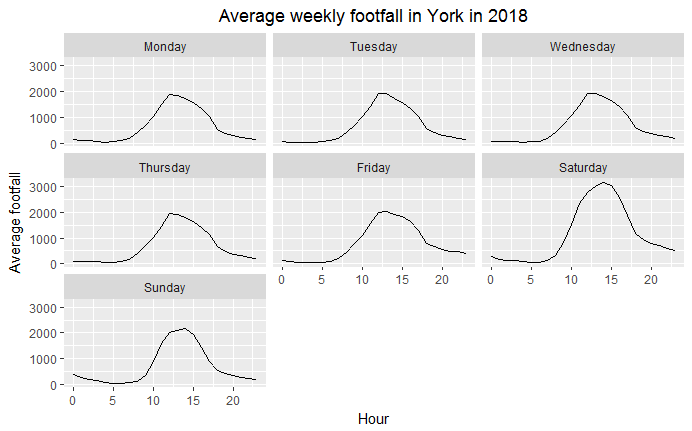
It is unsurprising that Saturday is the busiest day of the week in York. It can also be seen that footfall peaks earlier (at midday or 1pm) on weekdays than at weekends (at 2pm).
Footfall started decreasing in 2013 but has risen more recently
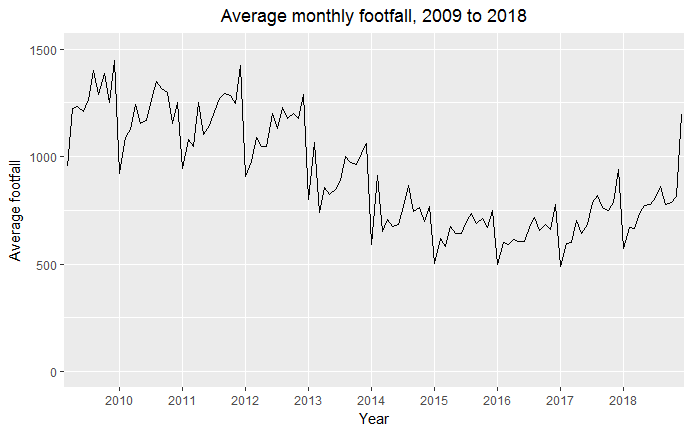
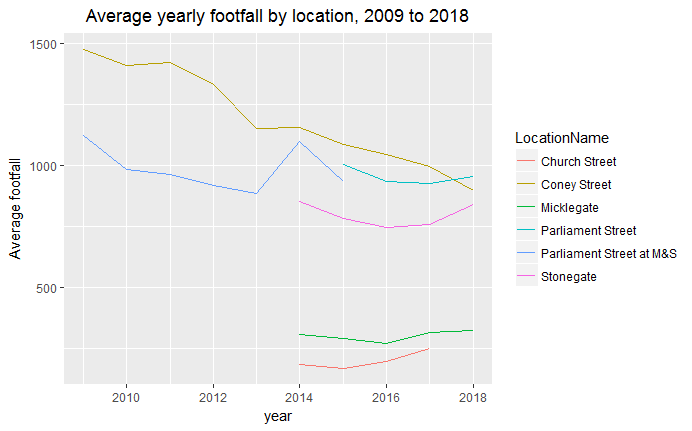
It is interesting to note the temporal pattern in monthly footfall, with expected increases towards the end of the year peak in Christmas shopping. We can also see that footfall began decreasing in 2013 with an upturn in recent years. I wondered whether there was a change in the location of footfall cameras which might account for these changes but this doesn't appear to be the case given the graph below.
I realise that this is a "quick and dirty" analysis of the data available and clearly much more could be done to fully analyse the data, including the different temporal patterns. Indeed, I expect I will return to it to explore some of these methods further.
Get the code
My code so far is available on Github and I always welcome comments or suggestions for improvements.
